Target
Our target for this lesson will be Assault Cube 1.2.0.2.
Overview
In previous lessons, we used x64dbg to debug and reverse games. After attaching x64dbg to these games, we were able to set breakpoints on game instructions. When the game executed these instructions, our breakpoints would pop and program execution would pause. We could then observe the values of all the registers and step through individual instructions.
In this lesson, we will explore how to create a debugger for Windows
utilizing the Windows API. We will confirm that this debugger is working
by using Assault Cube as an example. In the No Recoil lesson, we identified that the
mov instruction at 0x0046366C was only
executed when the player was firing. After we create our debugger, we will
place a breakpoint on this instruction and verify that it is only hit when
we fire.
Windows Debugger API’s
Windows has a collection of API’s that allow for a process to attach to and debug another process. These are detailed in several short articles available on MSDN.
For our purposes, we mainly care about the following API’s:
- DebugActiveProcess, which is used to attach to a target process
- WaitForDebugEvent, which is used to wait for debugging events, as described in this MSDN article
- ContinueDebugEvent, which is used to continue execution after a debug event is triggered
When using these API’s, we are attaching to a process and waiting for it to trigger one of several debug events, such as creating a thread or encountering an exception. However, when debugging a target we do not have the source code to, this will limit us to only breaking on thread and process creation events.
To be able to trigger a breakpoint on an address, we will need to use an
interrupt instruction. Interrupt instructions are a
special set of software instructions that invoke a special interrupt
handler on the CPU. One of these instructions, int 3,
will trigger a breakpoint when executed. Its opcode is 0xCC.
We can utilize this behavior to set a breakpoint on any instruction.
Before we attach a debugger to a process, we will use
WriteProcessMemory to write 0xCC to the
instruction we wish to break on. We will then listen for debug events like
normal. When we get a breakpoint event, we will restore the instruction to
its original form and continue execution. By doing this, we can set
breakpoints on any instruction in targets that we do not have the source
control to.
The full source code for the debugger discussed in this lesson is available on github.
Writing the Int 3 Instruction
To write our int 3 instruction into the target, we will
use an approach covered in previous lessons. First, we will iterate over all
processes in the system using
CreateToolhelp32Snapshot and locate the Assault Cube
process (ac_client.exe). Then, we will open a handle to
the process, and use that handle to write 0xCC (the opcode
for int 3) over the instruction at
0x0046366C:
HANDLE process_snapshot = NULL;
HANDLE process_handle = NULL;

DWORD pid;
DWORD bytes_written = 0;

BYTE instruction_break = 0xcc;

PROCESSENTRY32 pe32 = { 0 };

pe32.dwSize = sizeof(PROCESSENTRY32);

process_snapshot = CreateToolhelp32Snapshot(TH32CS_SNAPPROCESS, 0);
Process32First(process_snapshot, &pe32);

do {
  if (wcscmp(pe32.szExeFile, L"ac_client.exe") == 0) {
    pid = pe32.th32ProcessID;

    process_handle = OpenProcess(PROCESS_ALL_ACCESS, true, pe32.th32ProcessID);
    WriteProcessMemory(process_handle, (void*)0x0046366C, &instruction_break, 1, &bytes_written);
  }
} while (Process32Next(process_snapshot, &pe32));
Since we will need the process identifier (or pid) of Assault Cube for the DebugActiveProcess API, we also store the pid for later use.
Main Debugger Loop
Next, we can use an identical model discussed on MSDN to attach to the target and handle debugger events. The code provided on MSDN enters a permanent loop that checks for debugging events and then continues execution when encountering an event.
DEBUG_EVENT debugEvent = { 0 };

DWORD continueStatus = DBG_CONTINUE;

DebugActiveProcess(pid);

for (;;) {
  continueStatus = DBG_CONTINUE;

  if (!WaitForDebugEvent(&debugEvent, INFINITE))
    return 0;

  switch (debugEvent.dwDebugEventCode) {
    case EXCEPTION_DEBUG_EVENT:
      switch (debugEvent.u.Exception.ExceptionRecord.ExceptionCode)
      {
        case EXCEPTION_BREAKPOINT:
          continueStatus = DBG_CONTINUE;
          break;
        default:
          continueStatus = DBG_EXCEPTION_NOT_HANDLED;
          break;
      }
      break;
    default:
      continueStatus = DBG_EXCEPTION_NOT_HANDLED;
      break;
  }

  ContinueDebugEvent(debugEvent.dwProcessId, debugEvent.dwThreadId, continueStatus);
}

CloseHandle(process_handle);
Handling the Breakpoint
With this structure setup, we can now begin handling debugger events. First, let’s verify that our int 3 breakpoint actually worked with a print statement:
case EXCEPTION_BREAKPOINT:
  printf("Breakpoint hit");

  continueStatus = DBG_CONTINUE;
  break;
Make sure Assault Cube is running and run the debugger we have built so far. It should immediately print out Breakpoint hit. If you then fire, it will print out Breakpoint hit again before the game crashes. This indicates that our breakpoint was set successfully.
However, crashing the target is not ideal. To fix this, we will need to adjust two things:
- Only trigger our breakpoint when the instruction is executed and not when we first run our program.
- Restore the original instruction after our breakpoint is executed.
When we first attach to a process, a breakpoint exception is triggered. Since we only want to handle our breakpoint on the instruction, we will ignore this first exception:
bool first_break_has_occurred = false;
case EXCEPTION_BREAKPOINT:
  if (first_break_has_occurred) {
    //only handle breakpoint events after the first exception
  }

  first_break_has_occurred = true;
Next, we can handle the crash that occurs after our breakpoint is
triggered. This crash occurs because we have replaced the original
mov opcode (0x8b) with our interrupt. After
executing our interrupt and our handling of the debug event, the game
tries to execute the next opcode, which is not valid. To resolve this, we
need to restore the mov instruction after handling our debug event.
The EIP (extended instruction pointer) register is used to track the current instruction executing. Each time an instruction is executed, it is changed to reflect the next instruction address to execute. When we execute our int 3 instruction, it is increased by 1. To restore the mov instruction, we need to first decrease it.
We can do this by opening the thread responsible for triggering the breakpoint and retrieving the context (registers) of the thread. We can then decrease the EIP register and set the thread’s context to our new values:
HANDLE thread_handle = NULL;
CONTEXT context = { 0 };

thread_handle = OpenThread(THREAD_ALL_ACCESS, true, debugEvent.dwThreadId);
if (thread_handle != NULL) {
  context.ContextFlags = CONTEXT_ALL;
  GetThreadContext(thread_handle, &context);

  context.Eip--;

  SetThreadContext(thread_handle, &context);
  CloseHandle(thread_handle);
EIP will now point to the original
mov instruction address again (0x0046366C).
However, the instruction at this location will still be
int 3. To fix this, we can use
WriteProcessMemory to write the original opcode back to
the address:
WriteProcessMemory(process_handle, (void*)0x0046366C, &instruction_normal, 1, &bytes_written);
With this change, Assault Cube will no longer crash when our breakpoint is triggered. In addition, we can set a breakpoint on the context.Eip– line of code and verify that we can view the contents of all registers when our breakpoint is triggered:
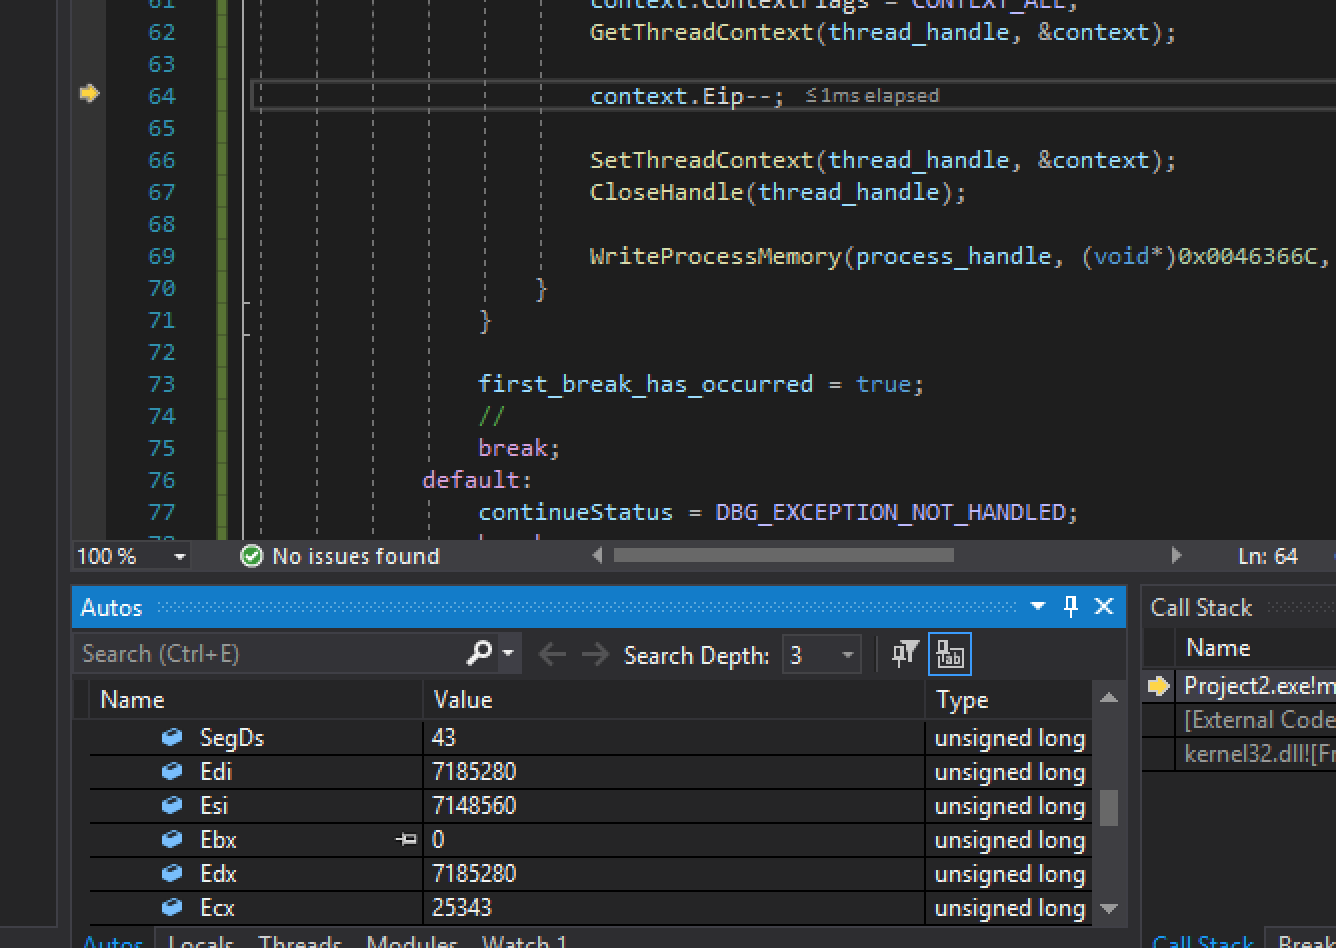
The same approach used to modify EIP can be used to modify other registers as well.