Target
Our targets in this lesson will be Wesnoth 1.14.9 and Wesnoth 1.14.12.
Overview
In the Changing Game Code lesson, we located the
sub instruction responsible for subtracting gold from our
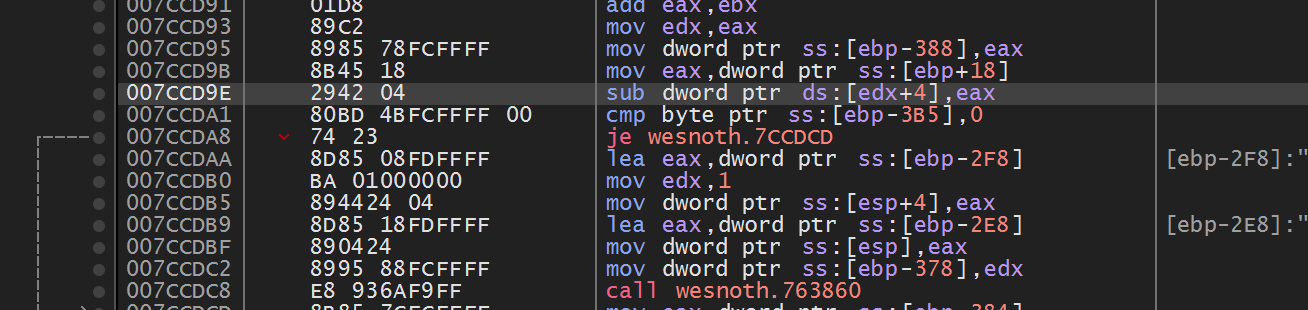
player when we recruited a unit. In the 1.14.9 version of the game, we
located this instruction at 0x7CCD9E:
If a game’s code is not loaded dynamically, addresses for instructions will not change. As such, we can consistently use them when programming. We used this behavior across several targets to build code caves, such as in the Code Caves & DLL’s lesson.
However, newer versions of Wesnoth have been released, like 1.14.12. This version can be installed using Chocolatey in the same way we installed version 1.14.9:
choco install wesnoth --version=1.14.12 -y
Most games will continually release additional versions and require
updates to continue playing on multiplayer servers. If we examine
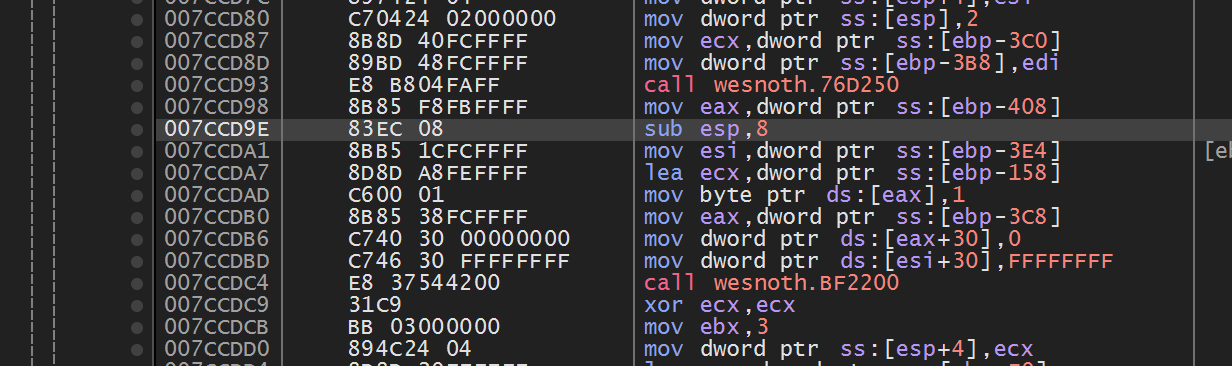
0x7CCD9E in Wesnoth 1.14.12, we see that the
sub instruction is no longer there:
When developers introduce new features or fix bugs in each release, they
modify the game’s code. They then compile these changes to produce a new
executable for the game. Since this new executable has different code, the
location of all code in the game will change. This is why the
sub instruction is no longer present at
0x7CCD9E in version 1.14.12.
Opcodes
If we wanted to find the new address of the
sub instruction, one approach is to repeat the exact same
method we used in the Changing Game Code lesson. If
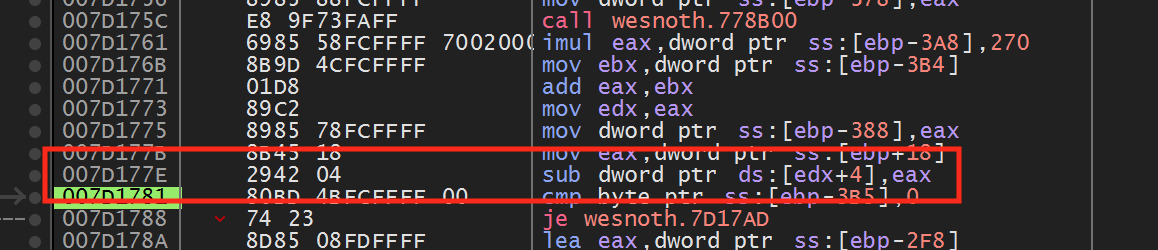
we do this, we can identify that the sub instruction in 1.14.12 is located
at 0x7D177E:
However, if we wanted to then upgrade our hack to a newer version, like 1.14.15, we would have to repeat this process again. This is a time-intensive process, especially for more complex tasks, like locating a player’s base pointer.
Back in the Computer Fundamentals lesson, we covered operation codes, or opcodes. Each opcode represents an instruction to execute. x64dbg displays the opcode for each instruction in the column to the left of the instruction:
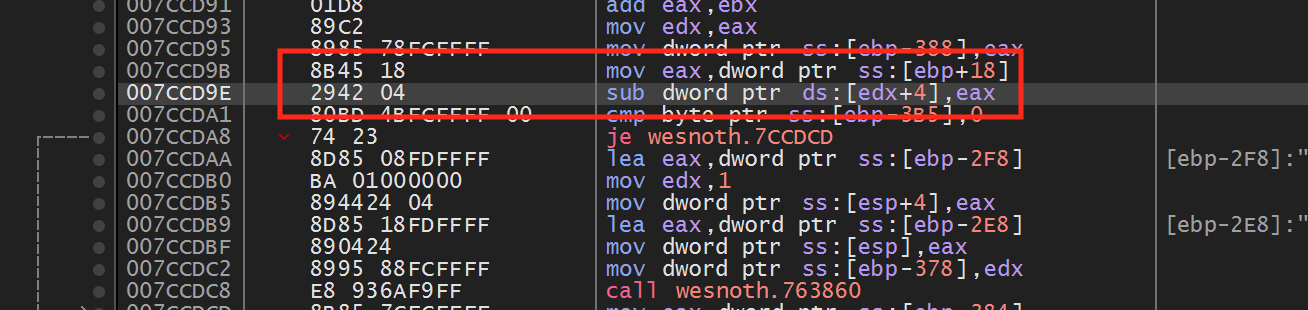
For example, the opcode for the sub instruction we
identified is 0x2942 04.
Executables do not store their code as assembly instructions. Rather, they store it as opcodes. The disassembly observed in x64dbg is reconstructed from these opcodes. We can verify this by opening up wesnoth.exe in a hex editor, a type of program that displays the hexadecimal bytes of a chosen file. In this lesson, we will use HxD:
choco install hxd
After opening wesnoth.exe, we can search for the opcode identified above via Search -> Find:
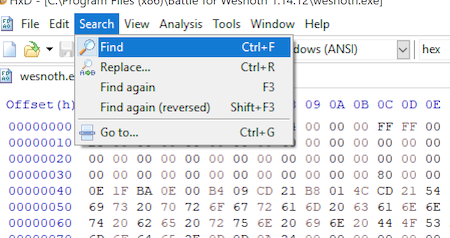
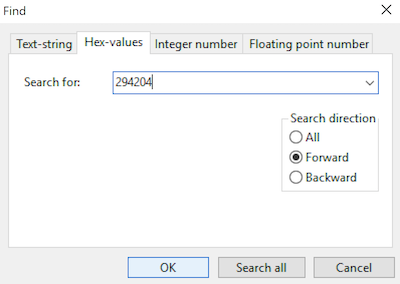
In the dialog that appears, we want to search for the hex value of our opcode:
Searching should highlight the opcode value:
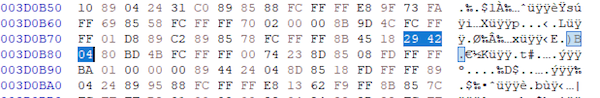
Looking at the values near the highlighted value, we can see that they represent the other opcodes near the sub instruction.
Scanning
If we compare the opcodes for the sub instruction between 1.14.9 and 1.14.12, we can see that they are identical. This is because the opcodes for a particular instruction will always be the same. Since these opcodes do not change, we can scan for these bytes to locate the instruction we care about. This is known as pattern scanning.
Due to how Windows loads PE files into virtual memory, the address for the instruction differs between the hex editor and x64dbg. Since we want to locate and alter the running code, we are interested in identifying the latter address.
To accomplish this, we need to read the memory from a running instance of Wesnoth and then search that memory for a series of bytes. In this lesson, we will write an external program to demonstrate the concept, but this same behavior can be used inside a DLL to automatically update offsets.
Since we want to locate a running process and retrieve a process handle, we can start with the base that we already discussed in the DLL Injector lesson:
#include <windows.h>
#include <tlhelp32.h>
#include <stdio.h>

int main(int argc, char** argv) {
  HANDLE snapshot = 0;
  PROCESSENTRY32 pe32 = { 0 };

  pe32.dwSize = sizeof(PROCESSENTRY32);
  snapshot = CreateToolhelp32Snapshot(TH32CS_SNAPPROCESS, 0);
  Process32First(snapshot, &pe32);

  do {
    if (wcscmp(pe32.szExeFile, L"wesnoth.exe") == 0) {
      HANDLE process = OpenProcess(PROCESS_ALL_ACCESS, true, pe32.th32ProcessID);

      CloseHandle(process);
      break;
    }
  } while (Process32Next(snapshot, &pe32));

  return 0;
}
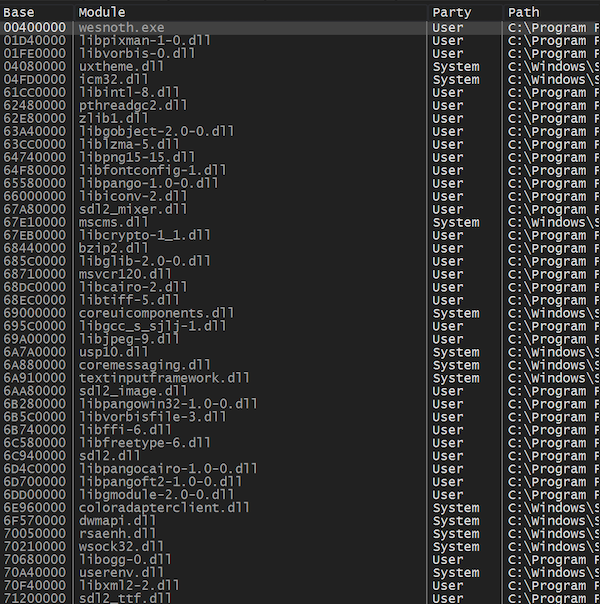
With the process handle to Wesnoth, our next goal is to read the process’s memory into a buffer that we can scan. However, processes are made up of many modules, or sections of code. For example, the Wesnoth process has modules for the main game code (wesnoth.exe), compression code (zlib1.dll), and graphics code (sdl.dll). We can observe all the modules loaded into the process using x64dbg’s Symbol tab:
Since our sub instruction is in the wesnoth.exe module, we only want to scan this memory. To do this, we want to identify the base address of the module and its size. The CreateToolhelp32Snapshot API also allows us to iterate over a process’s modules using Module32First and Module32Next:
if (wcscmp(pe32.szExeFile, L"wesnoth.exe") == 0) {
  HANDLE process = OpenProcess(PROCESS_ALL_ACCESS, true, pe32.th32ProcessID);

  HANDLE module_snapshot = 0;
  MODULEENTRY32 me32;

  me32.dwSize = sizeof(MODULEENTRY32);
  module_snapshot = CreateToolhelp32Snapshot(TH32CS_SNAPMODULE, pe32.th32ProcessID);
  Module32First(module_snapshot, &me32);
  do {
    if (wcscmp(me32.szModule, L"wesnoth.exe") == 0) {

      break;
    }
  } while (Module32Next(module_snapshot, &me32));

  CloseHandle(process);
  break;
}
At this point, the me32 structure will hold a few members that we care about: modBaseAddr, the base address of the module, and modBaseSize, the size of the module. We will use these two members to allocate a buffer and read the module’s memory into the buffer:
unsigned char *buffer = (unsigned char*)calloc(1, me32.modBaseSize);
DWORD bytes_read = 0;

ReadProcessMemory(process, (void*)me32.modBaseAddr, buffer, me32.modBaseSize, &bytes_read);

//scanning code

free(buffer);
At this point, our buffer contains the content of the memory from the wesnoth.exe module base to the end of the module. This memory contains the opcodes for the game’s code. We can now scan over this memory to look for our pattern of bytes.
For each byte in the buffer, we will see if the pattern exists starting at the byte. If not, we will continue on to the next byte. If all the bytes match, we will print the offset in the buffer combined with the wesnoth.exe module base:
unsigned char bytes[] = { 0x29, 0x42, 0x04 };

for (unsigned int i = 0; i < me32.modBaseSize - sizeof(bytes); i++) {
  for (int j = 0; j < sizeof(bytes); j++) {
    if (bytes[j] != buffer[i + j]) {
      break;
    }

    if (j + 1 == sizeof(bytes)) {
      printf("%x\n", i + (DWORD)me32.modBaseAddr);
    }
  }
}
If we start Wesnoth 1.14.12 and then run our scanner, it will correctly print out the location of the sub instruction:
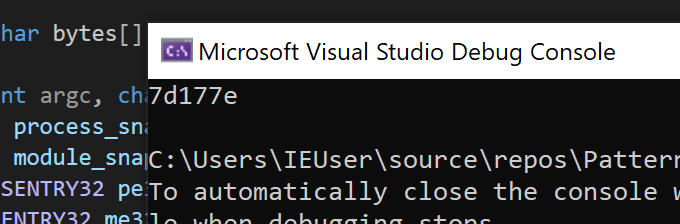
We can use this on any version of Wesnoth to locate the sub instruction we care about.
The full code for this lesson is available on github for comparison.