Target
Our target in this lesson will be Wesnoth 1.14.9.
Identify
Our goal in this lesson is to change Wesnoth’s code so that recruiting units does not decrease our gold.
Understand
To modify the game’s code, we will need to use a debugger. To locate the game code to modify, we will set a breakpoint on our gold address and then recruit a unit. Our debugger will pop at the code responsible for decreasing our gold. We can then nop out the sub instruction.
Locating Gold
Our first step is opening up Wesnoth and creating a local game. Then you can follow the steps in the Memory Hack lesson to find your gold address. Due to a process called Dynamic Memory Allocation (or DMA), it will be at a different address than before. We will cover DMA in a future lesson. Once you have found your new gold address, close down Cheat Engine but keep Wesnoth open. In this lesson, we will use the value of 0x051D875C as our gold address.
Attaching the Debugger
Next, start the 32-bit version of x64dbg. It can be found at C:\ProgramData\chocolatey\lib\x64dbg.portable\tools\release\x32\x32dbg.exe. Once started, open the File menu and choose Attach.
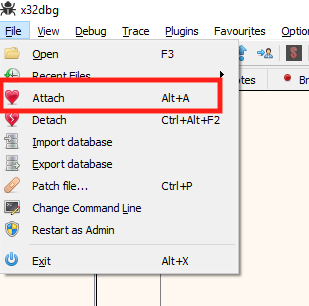
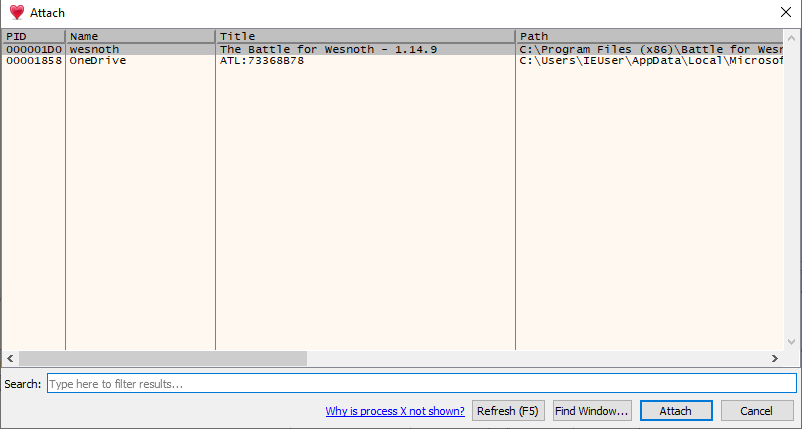
In the attach dialog that opens up, choose the Wesnoth process and hit Attach. This will attach our debugger to the Wesnoth process.
Upon attaching, x64dbg will pop in a module called ntdll.dll and display a lot of information.
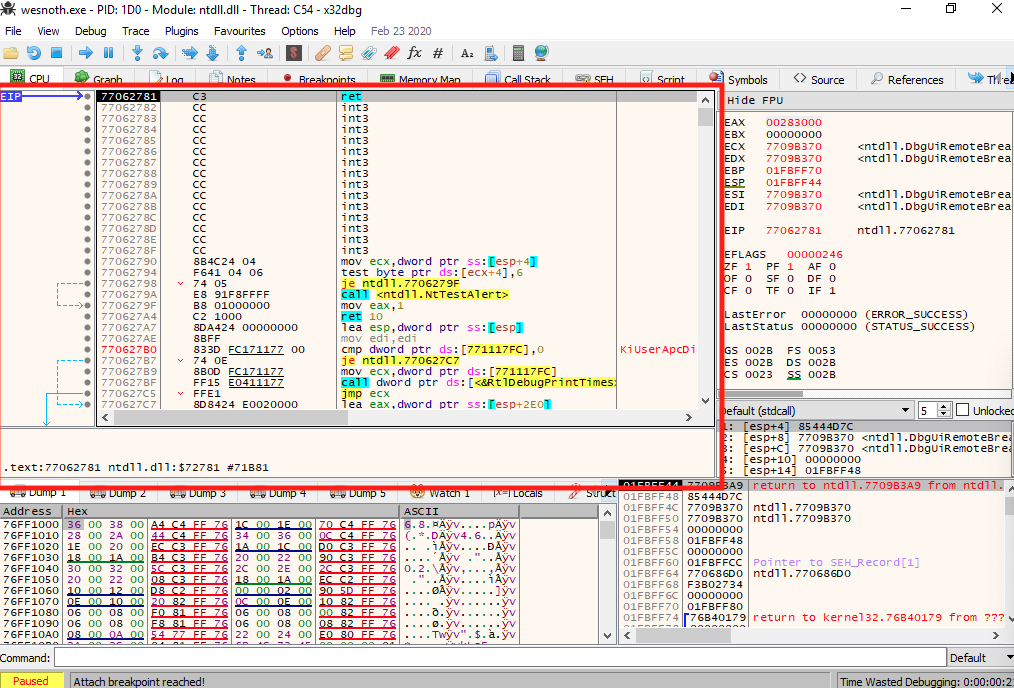
Before we dive into reversing, let’s quickly cover the major components in any debugger. The highlighted section contains the code being executed. The dump section directly below displays the memory of the application in its hexadecimal (hex) and ASCII representation. To the right of the code section is a list of all registers and their values. Below the registers is the application’s stack.
In this lesson, we will only be using the code section and the dump section. For more complex hacks, understanding all these sections will be necessary. Different debuggers will always contain all of this information, but they will often arrange them in different ways.
We are currently viewing the ntdll.dll module. This is not our target, but it’s a common module loaded into all Windows executables. To view the game’s code, we need to navigate to the Symbols tab and double-click on wesnoth.exe.
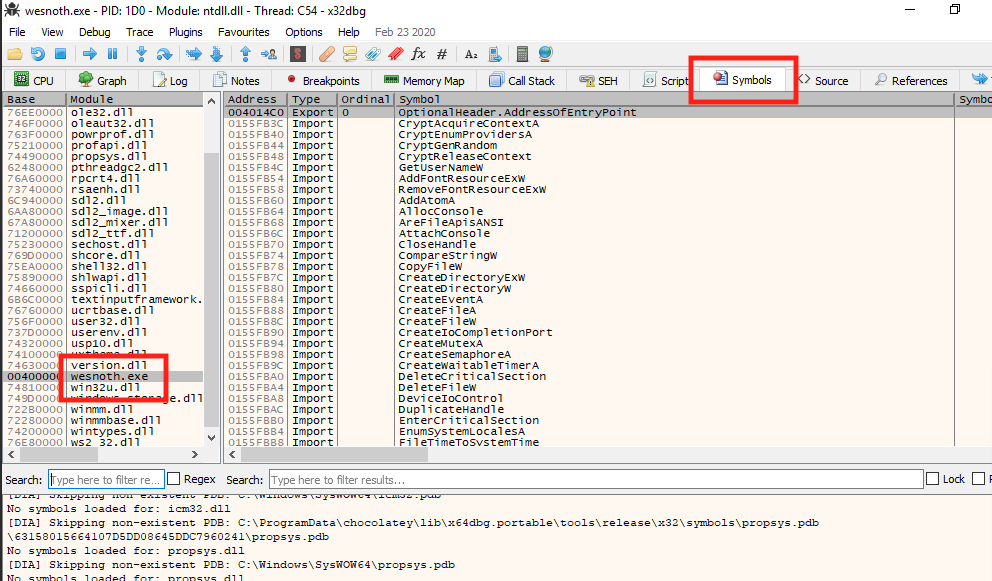
This will switch our view to the game’s code and memory space.
Setting Up the Debugger
Certain default settings in x64dbg will make it pop when we do not want it to. To make reversing in this lesson and future lessons easier, we will disable these settings.
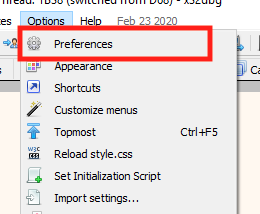
In the top menu, choose Options -> Preferences.
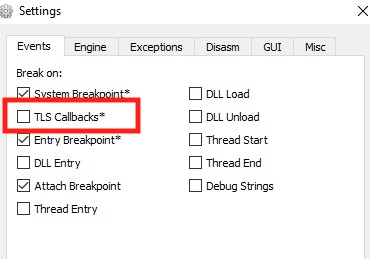
In the modal that opens, uncheck the TLS Callbacks option and select Save. This will disable x64dbg from automatically popping when receiving a TLS callback.
Setting a Breakpoint
Next, we will set a breakpoint on our gold location. After we set this breakpoint, we will go into Wesnoth and recruit a unit. Doing so will cause the breakpoint to pop and pause execution at the location responsible for subtracting gold.
Right-click in the dump section and choose Go to -> Expression:

In the dialog that opens, type in our gold address and hit OK.

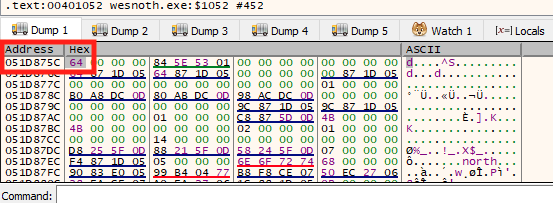
The dump will then show the address we just typed in. The data displayed is in hexadecimal format. In the target game, the player had 100 gold. 100 in hexadecimal format is 0x64. This is the value displayed in the dump.
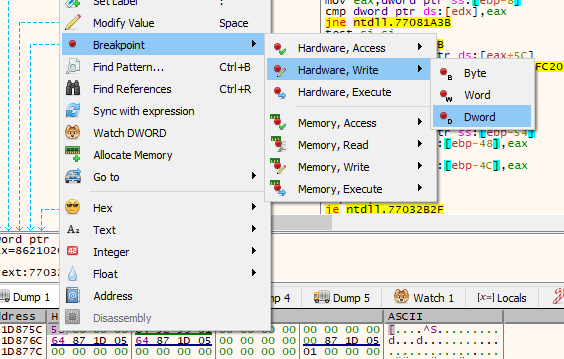
Right-click on the value and choose Breakpoint -> Hardware, Write -> DWORD. This will set a conditional breakpoint on this memory address. The condition for popping is any modification of the memory address.
With our breakpoint set, we will now resume execution of the program. This can be done by pressing the Play button until the Paused status disappears and the game resumes. You will have to do this several times due to the several breakpoints that x64dbg automatically creates.

Locating Code
Once the game resumes, go back into Wesnoth and recruit a unit. You will notice that Wesnoth will freeze due to our breakpoint popping and pausing execution. Navigate back to x64dbg to see where it popped.
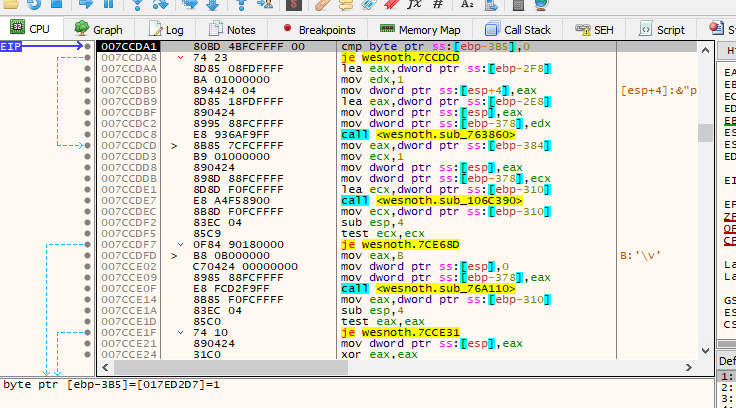
The highlighted EIP represents the current location of execution within the program. EIP stands for Extended Instruction Pointer and is a special register used by programs to understand the current execution location.
From our last lesson, we know that conditional breakpoints are triggered after the operation that affected the memory in question. Scroll up in the code window to see the previous instructions.

The highlighted sub instruction was responsible for modifying our gold value. As we remember from previous lessons, sub stands for subtract and is responsible for subtracting two numbers. In this case, it is subtracting the value held in the memory location stored in edx + 4 and eax. The exact specifics of these values are not necessary to know now. All we need to know is that this operation is affecting our gold in some way.
Change
Finally, we will change this code and finish our hack. To do this, we will replace the sub instruction with the nop instruction. This will replace the subtraction with an operation that does nothing. As a result, our gold will no longer decrease. Luckily, x64dbg contains a built-in way to automatically nop out an instruction. Right-click on the line with the subtract instruction and choose Binary -> Fill with NOPs.

x64dbg will populate the next values for you automatically. Just select OK on the next screen.
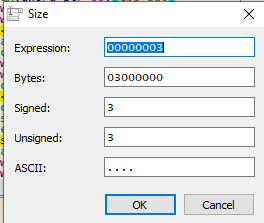
If done correctly, the code should now look like the image below. You will notice there are three nop instructions. We will cover why in a future lesson.

Before we can verify that our change has worked, we need to disable our breakpoint so that it doesn’t pop again. To do this, first go to the Breakpoints tab. This tab contains a list of all the breakpoints we have set in the application.

Right-click on the breakpoint you have set and choose Remove.
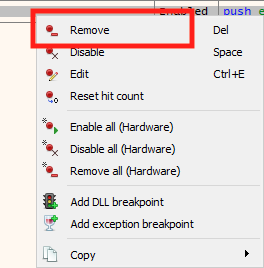
With the breakpoint removed and the code changed, we can now go back into Wesnoth and observe our changes. Recruit a few units and observe that your gold no longer goes down.